The role of ‘omics in microbiome research
To understand how a microbiome functions it is imperative to understand first, what genes (organisms) are present. Second, which of these genes are being actively expressed. Third, the function of the genes being expressed. Fourth, the activity of the proteins which are being made and fifth, the role of the metabolites produced by the microbiome.
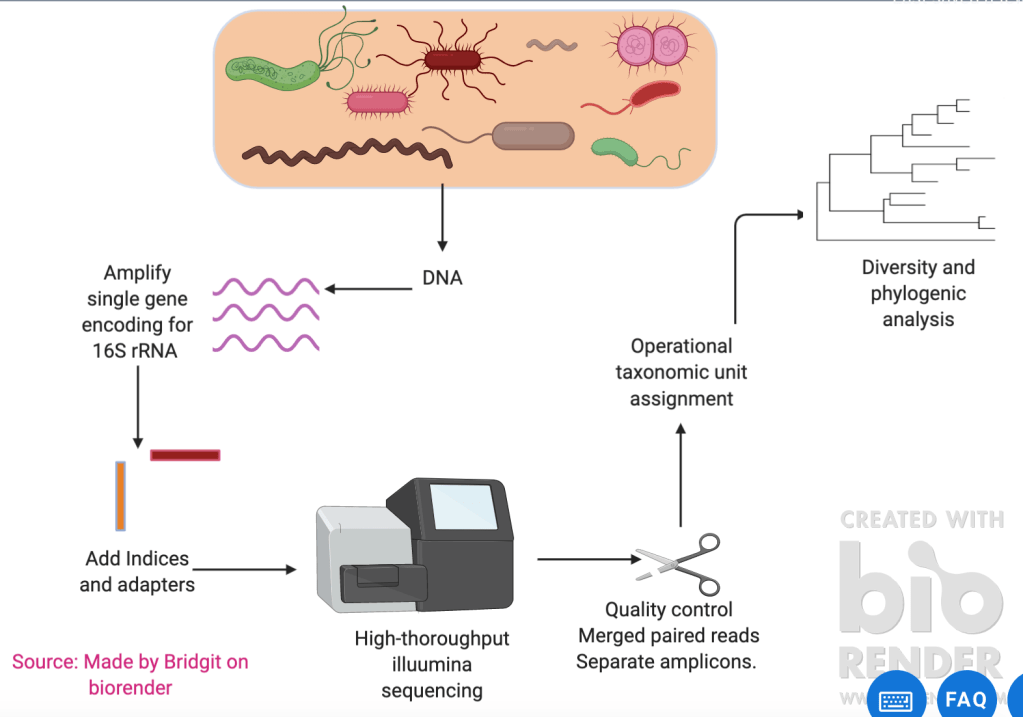
Metagenomics analyses the total DNA or RNA contents of a microbiome sample. One method of providing a snapshot of the composition of a microbiome is through metabarcoding. Metabarcoding involves extracting DNA from a sample and then using universal PCR primers to mass-amplify DNA barcodes from highly conserved regions of DNA (in bacteria this is usually the 16SrRNA and in fungi this is ITS (1 or 2). The PCR product is then run through high throughput sequencing (illumina Misiq). The DNA sequences then undergo quality control, merge the paired reads and separate amplicons. It is then analysed and organised into operational taxonomic units so diversity and phylogenic analysis of the microbiome sample can occur. Refer to figure 1 for diagram highlighting the metabarcoding process.
Metabarcoding is useful as it provides a quick snapshot of a microbiome under specific conditions. This can help to draw correlations between environmental factors and changes in microbiome composition. For example, metabarcoding of 16SrRNA of bacteria in the wheat head microbiome (Chen et al., 2018) illustrated that the community composition of a healthy wheat head and a wheat head infected with a fungal pathogen fusarium gramarium was very different. At the genus level, Paenibacillus, Sphingomonas and Pseudomonas species all increased in the infected wheat head microbiome. Notably, there was a 10-fold increase in pseudomonas species which are known to be antagonistic to the fusarium gramarium fungus. Similarly, (Unyarat et al., 2015) used 16SrRNA metabarcoding to highlight that the phyllosphere bacterial communities in cuticle mutants (bodyguard and longchain fatty acid synthase 2) were significantly different to the wild type. 16SrRNA analysis revealed that both the mutants had the most abundant genera being Pseodomonas and Rhizobium whereas the wild type had Burkholderia. As both mutants had increased resistance to the fungal pathogen Botrytis cinera a correlation could be made between the microbiome and increased resistance to the pathogen.
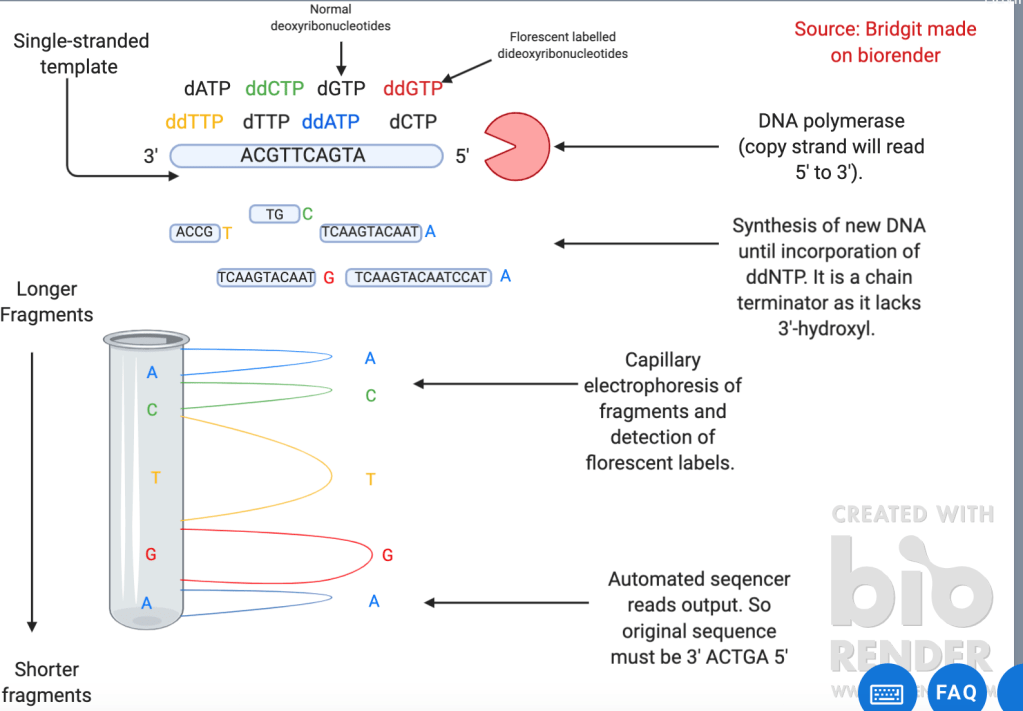
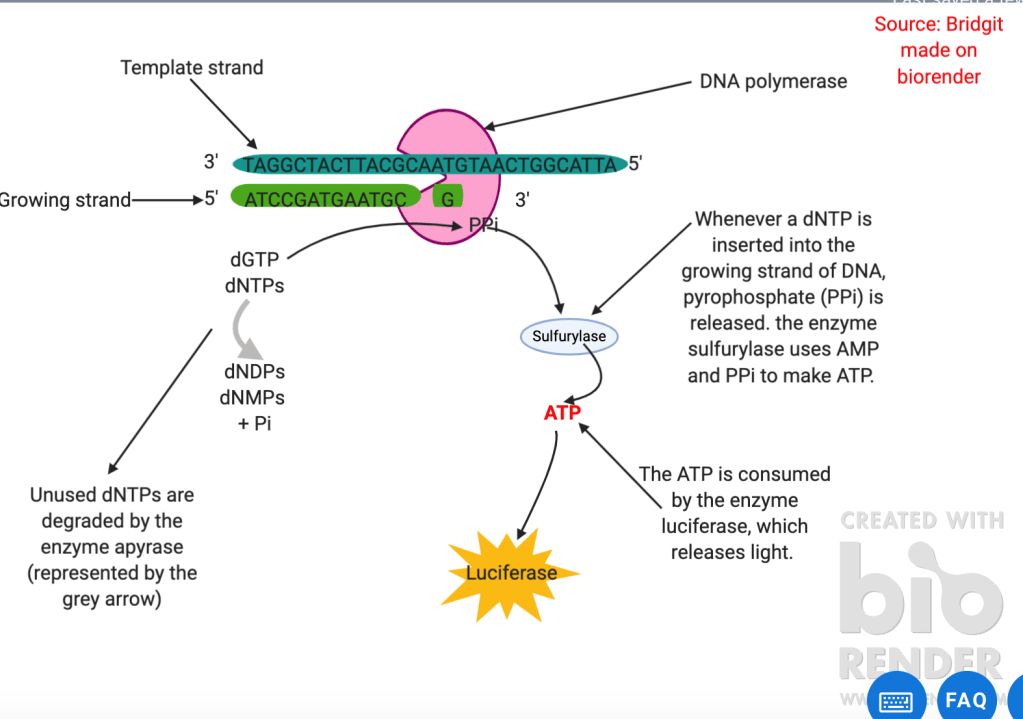
However, metabarcoding only provides a snapshot of the microbes present in the environmental sample. It does not provide insight into the functional capabilities of that sample. Therefore, further ‘omic’ studies including genomics and metabolomics are important to plant microbiome research. Genome sequencing can be done in many ways including sanger (refer to figure 2) and pyrosequencing (refer to figure 3). An example of genomics in the plant microbiome was used when a complete genome sequence of one of the bacteria present in the infected wheat head microbiome (ZJU60) was done using pacbio 2. This revealed that the bacteria had 11 putative gene clusters for the biosynthesis of secondary metabolites with potential antimicrobial activities including phenazine and siderophores. Further analysis showed it had the genes encoding for 4 antifungal secondary metabolites. (Phenazine, hydrogen cyanide, pyvodorine and achromobactin. Silencing of the operons involved in these can then be used to see which metabolite is antagonistic to the fusarium gramarium fungus.
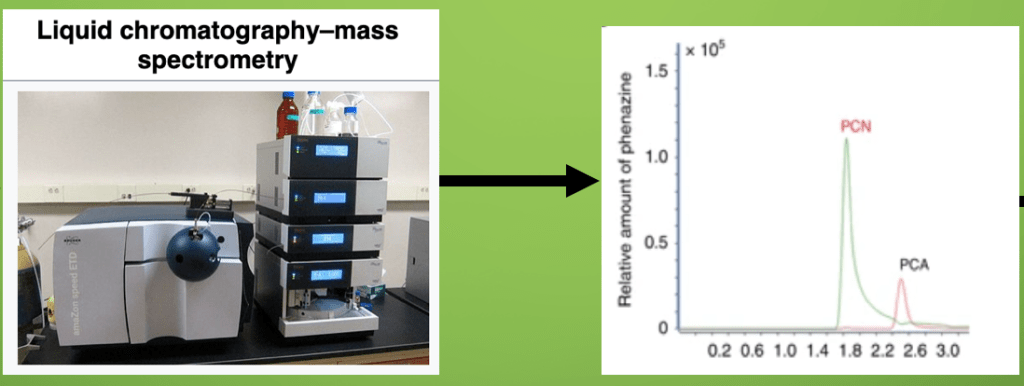
Metabolomics reflects the enzymatic pathways encoded for in a genome. Metabolomics can be used to confirm that potential reactions actually occur in a cell in a given physiological state. Liquid chromatographic mass spectrometry and matrix-assisted laser desorption ionization spectrometry are two methods to identify secondary metabolites produced by the plant microbiome. There are slight differences in these techniques but both involve ionising the metabolite in question. The ions travel down a tube through a charged grid to a detector. The time taken to reach the detector (TOF) depends on the mass/charge ratio of the ion. Computers can then use the TOF to identify the ions and piece together the metabolite. As highlighted in figure 4, liquid chromatographic mass spectrometry confirmed that the secondary metabolite produced by the ZJU60 bacteria was PCN phenazine